PchipDemo.m
Contents
Overview
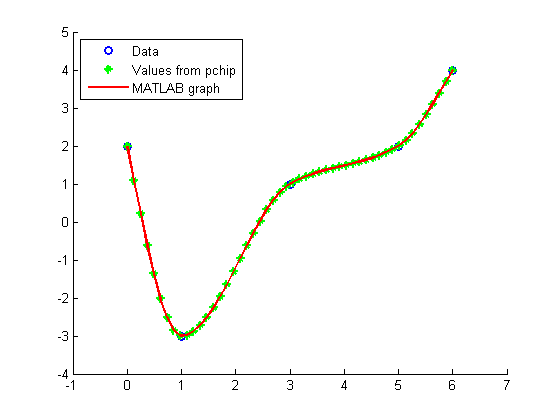
Illustrates piecewise cubic Hermite interpolation by calling pchip (which evaluates the piecewise polynomial interpolating the data in the vectors x and y at the list of points in the vector u)
As output we get plots of
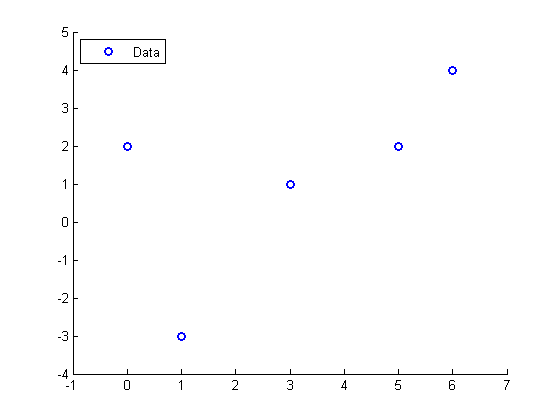
- the data,
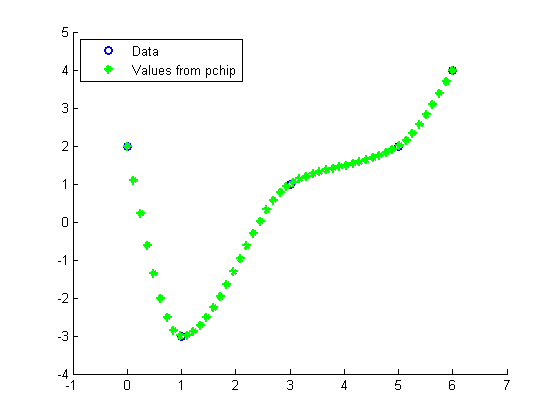
- values obtained from pchip,
- and a smooth MATLAB graph.
Initialization
clear all
close all
% Define the data and evaluation points
x = [3 1 5 6 0];
y = [1 -3 2 4 2];
u = linspace(0,6,50);
Call pchip
Evaluate piecewise cubic Hermite interpolant at all points in u
v = pchip(x,y,u);
Plots
Plot the data
hold on
xlim([-1 7])
ylim([-4 5])
plot(x,y,'bo','LineWidth',2)
legend('Data','Location','NorthWest')
pause
Plot the values computed with pchip
plot(u,v,'g*','LineWidth',2)
legend('Data','Values from pchip','Location','NorthWest')
pause
Let MATLAB do some more interpolation to get a continuous graph
plot(u,v,'r','LineWidth',2)
legend('Data','Values from pchip','MATLAB graph','Location','NorthWest')
hold off